Radio sniffer with M3 nodes
![]() Difficulty: Medium
Difficulty: Medium
![]() Duration: 30 minutes
Duration: 30 minutes
Prerequisites: Configure SSH Access / Submit an experiment with M3 nodes using the web portal / Nodes Serial Link Aggregation
Description: Each node of an experiment is monitored by its Control Node (users have no access to it). It monitors node consumption, radio, selects power supply (battery or DC). A Profile represents the Control Node configuration during the experiment. The aim of this tutorial is to create a profile for capturing and analyzing radio communication. You can capture frames in defined channel over the air and visualize them in Wireshark.
Note: Wireshark must be installed on your PC (mypc_ubuntu> sudo apt-get install wireshark)
- Log into the Webportal
- Select the Resources / Monitoring profiles tab
- Click the New profile button to create a new profile
- Set this monitoring profile with
- Name sniff_11 and Architecture M3
- Monitor Radio with sniffer on Channel 11 (default channel in the tutorial firmware)
- Save this new profile.
- Submit a new experiment
- Duration : 20 minutes and select “As soon as possible”
- Choose around 5 M3 nodes with same radio neighborhood
- Click on node id link
- Select Archi = M3 (at86rf231) / Site = Grenoble / IDs = 7 (sniffer node in our experiment) and click Add to experiment
- Select Archi = M3 (at86rf231) / Site = Grenoble / IDs = 8-11 and click Add to experiment
- For nodes association: use the monitoring profile you have created earlier and the tutorial firmware file
- Add firmware and profile for m3-7 node (sniffer node in our experiment)
- Add firmware for other nodes (m3-[8-11])
- Click on the experiment in the list and wait for the experiment to become running.
- Connect to the SSH frontend of Grenoble
ssh <login>@grenoble.iot-lab.info
- If you didn’t authenticate using iotlab-auth, do it now:
<login>@<site>:~$ iotlab-auth -u login
- Interact with the nodes. Connect to all nodes using
serial_aggregator<login>@grenoble:~$ serial_aggregator 1421069467.222714;Aggregator started 1421069467.380965;m3-7;A 1421069467.381105;m3-7; 1421069467.382198;m3-7;IoT-LAB Simple Demo program 1421069467.382308;m3-7;Type command 1421069467.390591;m3-7; h: print this help 1421069467.390705;m3-7; t: temperature measure 1421069467.390800;m3-7; l: luminosity measure 1421069467.390889;m3-7; p: pressure measure 1421069467.391089;m3-7; s: send a radio packet 1421069467.391181;m3-7; b: send a big radio packet 1421069467.391376;m3-7; e: toggle leds blinking 1421069467.391474;m3-7; 1421069467.391560;m3-7; Type Enter to stop printing this help # Hit "Space+Enter" to stop the flood.
- Use Sniffer aggregator in another terminal with your sniffer node
<login>@grenoble:~$ sniffer_aggregator -l grenoble,m3,7 -o m3-7.pcap
1421070437.561983;Aggregator started
Thesniffer_aggregatoris a python script based on the cli-tools and asyncore to aggregate all the nodes sniffer links (TCP socket on port 30000). - Send a packet with your sniffer node from the
serial_aggregatorm3-7;s 1421071098.774563;m3-7;cmd > 1421071098.774889;m3-7;radio > Packet sent 1421071098.775016;m3-7; 1421071098.775577;m3-11;cmd > 1421071098.775741;m3-10;cmd > 1421071098.775966;m3-8;cmd > 1421071098.776343;m3-9;cmd > 1421071098.776828;m3-11;radio > Got packet from 2261. Len: 16 Rssi: -50: 'Hello World!: 0' 1421071098.776943;m3-11; 1421071098.777363;m3-10;radio > Got packet from 2261. Len: 16 Rssi: -49: 'Hello World!: 0' 1421071098.777479;m3-10; 1421071098.777632;m3-8;radio > Got packet from 2261. Len: 16 Rssi: -50: 'Hello World!: 0' 1421071098.777970;m3-8; 1421071098.778143;m3-9;radio > Got packet from 2261. Len: 16 Rssi: -64: 'Hello World!: 0' 1421071098.778223;m3-9;
- Send a big packet with another node
m3-11;b
1421071240.053937;m3-11;cmd >
1421071240.054842;m3-11;radio > Big packet sent
1421071240.054965;m3-11;
1421071240.056961;m3-7;cmd >
1421071240.057126;m3-9;cmd >
1421071240.057558;m3-10;cmd >
1421071240.057842;m3-8;cmd >
1421071240.059232;m3-8;radio > Got packet from 8679. Len: 60 Rssi: -45: 'Big Hello World!: 0 012345678901234567890123456789012345678'
1421071240.059847;m3-10;radio > Got packet from 8679. Len: 60 Rssi: -46: 'Big Hello World!: 0 012345678901234567890123456789012345678'
1421071240.060044;m3-10;
1421071240.060173;m3-9;radio > Got packet from 8679. Len: 60 Rssi: -61: 'Big Hello World!: 0 012345678901234567890123456789012345678'
1421071240.060261;m3-9;
1421071240.060699;m3-8;
1421071240.061153;m3-7;radio > Got packet from 8679. Len: 60 Rssi: -49: 'Big Hello World!: 0 012345678901234567890123456789012345678'
1421071240.061248;m3-7;
- Close the sniffer aggregator script (Ctrl-C)
<login>@grenoble:~$ sniffer_aggregator -l grenoble,m3,7 -o m3-7.pcap
1421070437.561983;Aggregator started
^C1421071309.916621;Stopping
1421071309.917010;m3-7;Connection closed
- View sniffer packets capture
<login>@grenoble:~$ /usr/sbin/tcpdump -v -r m3-7.pcap reading from file m3-7.pcap, link-type EN10MB (Ethernet) 14:58:18.776806 IP (tos 0x0, ttl 255, id 0, offset 0, flags [DF], proto UDP (17), length 82) localhost.17754 > localhost.17754: UDP, length 54 15:00:40.059490 IP (tos 0x0, ttl 255, id 0, offset 0, flags [DF], proto UDP (17), length 126) localhost.17754 > localhost.17754: UDP, length 98 - Analyse the traffic in wireshark on your computer. In the tutorial firmware we use a custom mac layer (CSMA) without 802.15.4 framing.
your@yourpc:~$ scp <login>@grenoble.iot-lab.info:m3-7.pcap m3-7.pcap
your@yourpc:~$ wireshark m3-7.pcap
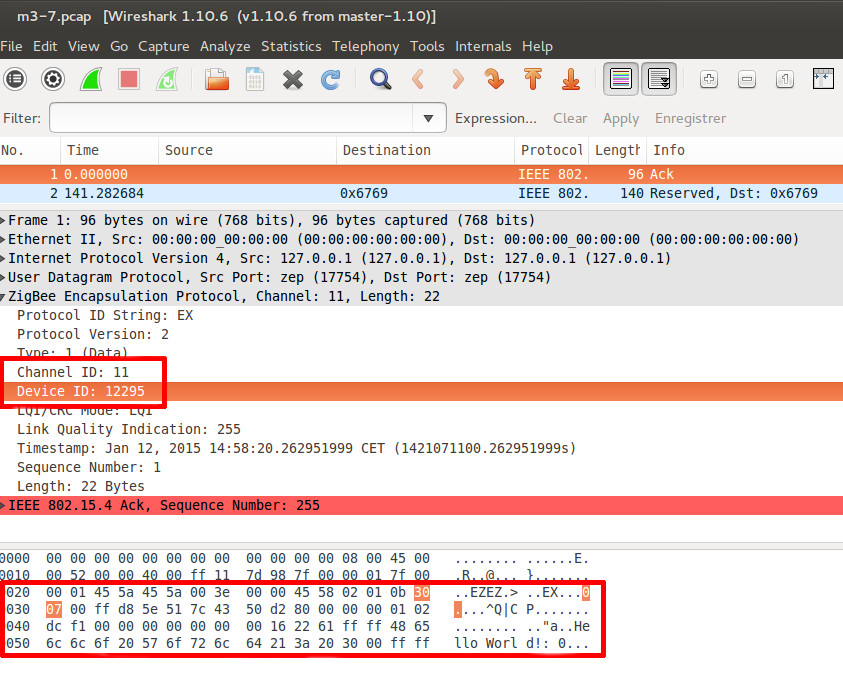
On the first screenshot you can see the channel and device ID informations of the sniffer node. You have 30 07 hexadecimal value (12295 in decimal system) in the frame for m3-7 node. You can view also the payload of the packet sent by m3-7 node with “Hello World” string.
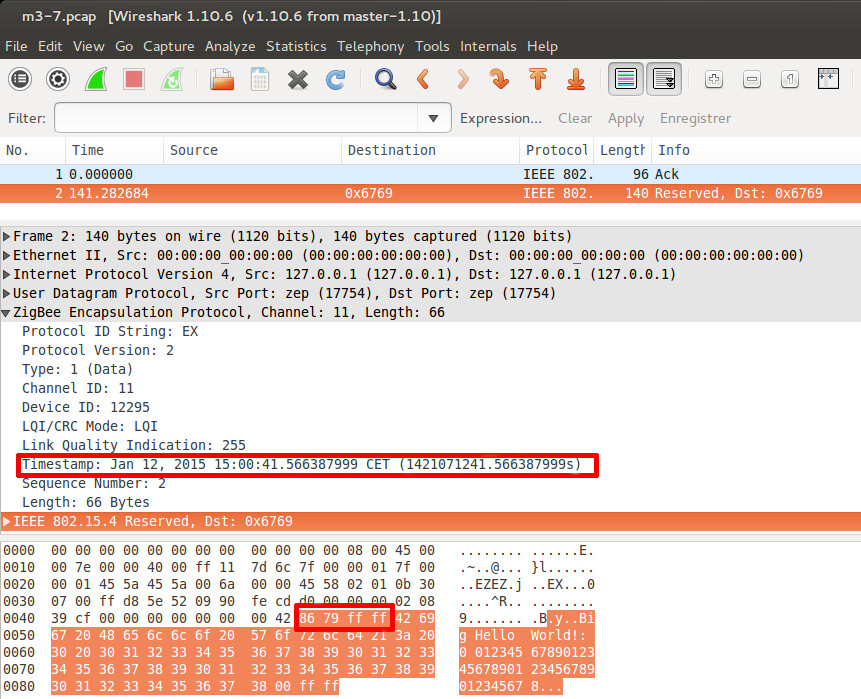
On the second screenshot you can view the capture of the second packet sent by m3-11 node with the payload “Big Hello World” string. The first two bytes of the frame contain the source and destination address of the packet: 8679 is the Iot-LAB uid of the node m3-11 and FFFF is the broadcast address. You can note also that you have a timestamp value which corresponds to reception of the packet by sniffer node. It’s the same common time base used by Control Node for monitoring consumption.
Additional details
For more details on the whole sniffer chain implementation, see the explaination on GitHub