Radio monitoring
Radio monitoring is an optional feature which measures the radio signal power (RSSI) or can be used as radio packet sniffer for IEEE 802.15.4. It refers to the Control Node dedicated hardware installed on the IoT-LAB node to enable the monitoring. It provides you an efficient passive monitoring solution which helps you to design IoT protocols or applications with radio communication. In this documentation you will learn how to create a Profile monitoring configuration and enable it for your experiment. Moreover you will figure out how to get and analyse the monitoring data.
RSSI monitoring
Create a monitoring profile
You have two ways to create a monitoring Profile, the IoT-LAB Webportal or CLI command-line tools. In both cases you must create a Profile with a name, M3 architecture and the following configuration:
- Monitor radio: RSSI mode.
- Channel 11 (used by the firmware) and 14 (unused channel)
- Period = 1 ms
- Number of measure by channel = 1
View this section for additional informations.
In the Webportal go to the Resources Monitoring page and click New profile button.
With command-line tools use these commands:
$ iotlab-auth -u <login> # optionally store your credentials if you haven't done it before.
$ iotlab-profile addm3 -n <profile_name> -rssi -channels 11 14 -rperiod 1 -num 1
Launch an experiment
To illustrate the radio monitoring we will launch an experiment with:
- a duration of 20 minutes
- two M3 nodes on Grenoble site
- a firmware with which we can send radio packets
- the radio monitoring profile we have just created.
In the Webortal go to the New Experiment page and select nodes by node properties (one M3 node on Grenoble site) and attach the preset firmware (iotlab_m3_tutorial) and the consumption monitoring profile.
You can note that it’s possible to have a different monitoring configuration for each node of your experiment.
With command-line tools use these commands:
$ wget https://iot-lab.github.io/assets/firmwares/tutorial_m3.elf .
$ iotlab-experiment submit -d 20 -l 2,archi=m3:at86rf231+site=grenoble,tutorial_m3.elf,<profile_name>
$ iotlab-experiment wait
$ iotlab-experiment get -ni
Send radio packets
Go to the frontend server and launch the serial_aggregator command. Choose one node to send five big radio packets (with the firmware shell) and visualize the good reception on the other one.
$ ssh -X <login>@grenoble.iot-lab.info # -X option enables X11 forwarding
<login>@grenoble:~$ serial_aggregator
...
# Hit "Space+Enter" to stop the flood.
m3-<id1>;b # send one big radio packet from the node m3-<id1>. Hit "Enter" to execute the command
1578307588.006162;m3-<id1>;cmd >
1578307588.006417;m3-<id1>;radio > Big packet sent
1578307588.006543;m3-<id1>;
1578307588.009438;m3-<id2>;cmd >
1578307588.011165;m3-<id2>;radio > Got packet from <UID_M3_ID1> (m3-<id1>). Len: 60 Rssi: -56: 'Big Hello World!: 0 012345678901234567890123456789012345678'
1578307588.011331;m3-<id2>;
m3-<id1>;b
1578307594.166009;m3-<id1>;cmd >
1578307594.166634;m3-<id1>;radio > Big packet sent
1578307594.166832;m3-<id1>;
1578307594.169027;m3-<id2>;cmd >
1578307594.171689;m3-<id2>;radio > Got packet from <UID_M3_ID1> (m3-<id1>). Len: 60 Rssi: -56: 'Big Hello World!: 1 012345678901234567890123456789012345678'
1578307594.171928;m3-<id2>;
... # Continue and send five packets in total
Analyse monitoring data
The monitoring data is stored on the frontend server in your home directory. You can find it in the ~/.iot-lab/<exp_id>/radio/ directory. We use the OML measurement library and you can find a file m3_<id>.oml for each monitored nodes.
Don’t worry if you have empty files, OML library performs caching. You have to wait a little while or manually stop the experiment to flush the cache.
Go to the frontend and view the monitoring OML file content:
$ ssh -X <login>@grenoble.iot-lab.info # -X option enables X11 forwarding
<login>@grenoble:~$ less ~/.iot-lab/<experiment id>/radio/m3_<id>.oml # .iot-lab/last is a symlink to your last experiment directory .iot-lab/<exp_id>
protocol: 4
domain: 4291
start-time: 1397726665
sender-id: m3-3
app-name: control_node_measures
schema: 0 _experiment_metadata subject:string key:string value:string
schema: 2 control_node_measures_radio timestamp_s:uint32 timestamp_us:uint32 channel:uint32 rssi:int32
content: text

0.620337	2	1	1397726665	577557	22	-91
0.620611	2	2	1397726665	578533	26	-91
0.620642	2	3	1397726665	579510	22	-91
0.620672	2	4	1397726665	580486	26	-91
....
RSSI stands for Received Signal Strength Indication. It is the relative received signal strength in a wireless environment. In IoT-LAB, measured RSSI values provide an indication of the radio power level received by the antenna of the Control Node hardware. The RSSI value is expressed in dBm (Decibel-milliwatts), and represents the power ratio in decibels (dB) of the measured power referenced to one milliwatt (mW). A power level of 0 dBm corresponds to 1mW.
We provide an OML plotting tool which helps you to analyse monitoring data. To use the plotting tool on MacOS you have to install XQuartz. Make sure to reboot your machine after the installation is complete.
# ONLY for MacOS user

$ brew install --cask xquartz
$ sudo reboot
# Connect using -X option to enable X11 forwarding
$ ssh -X <login>@grenoble.iot-lab.info
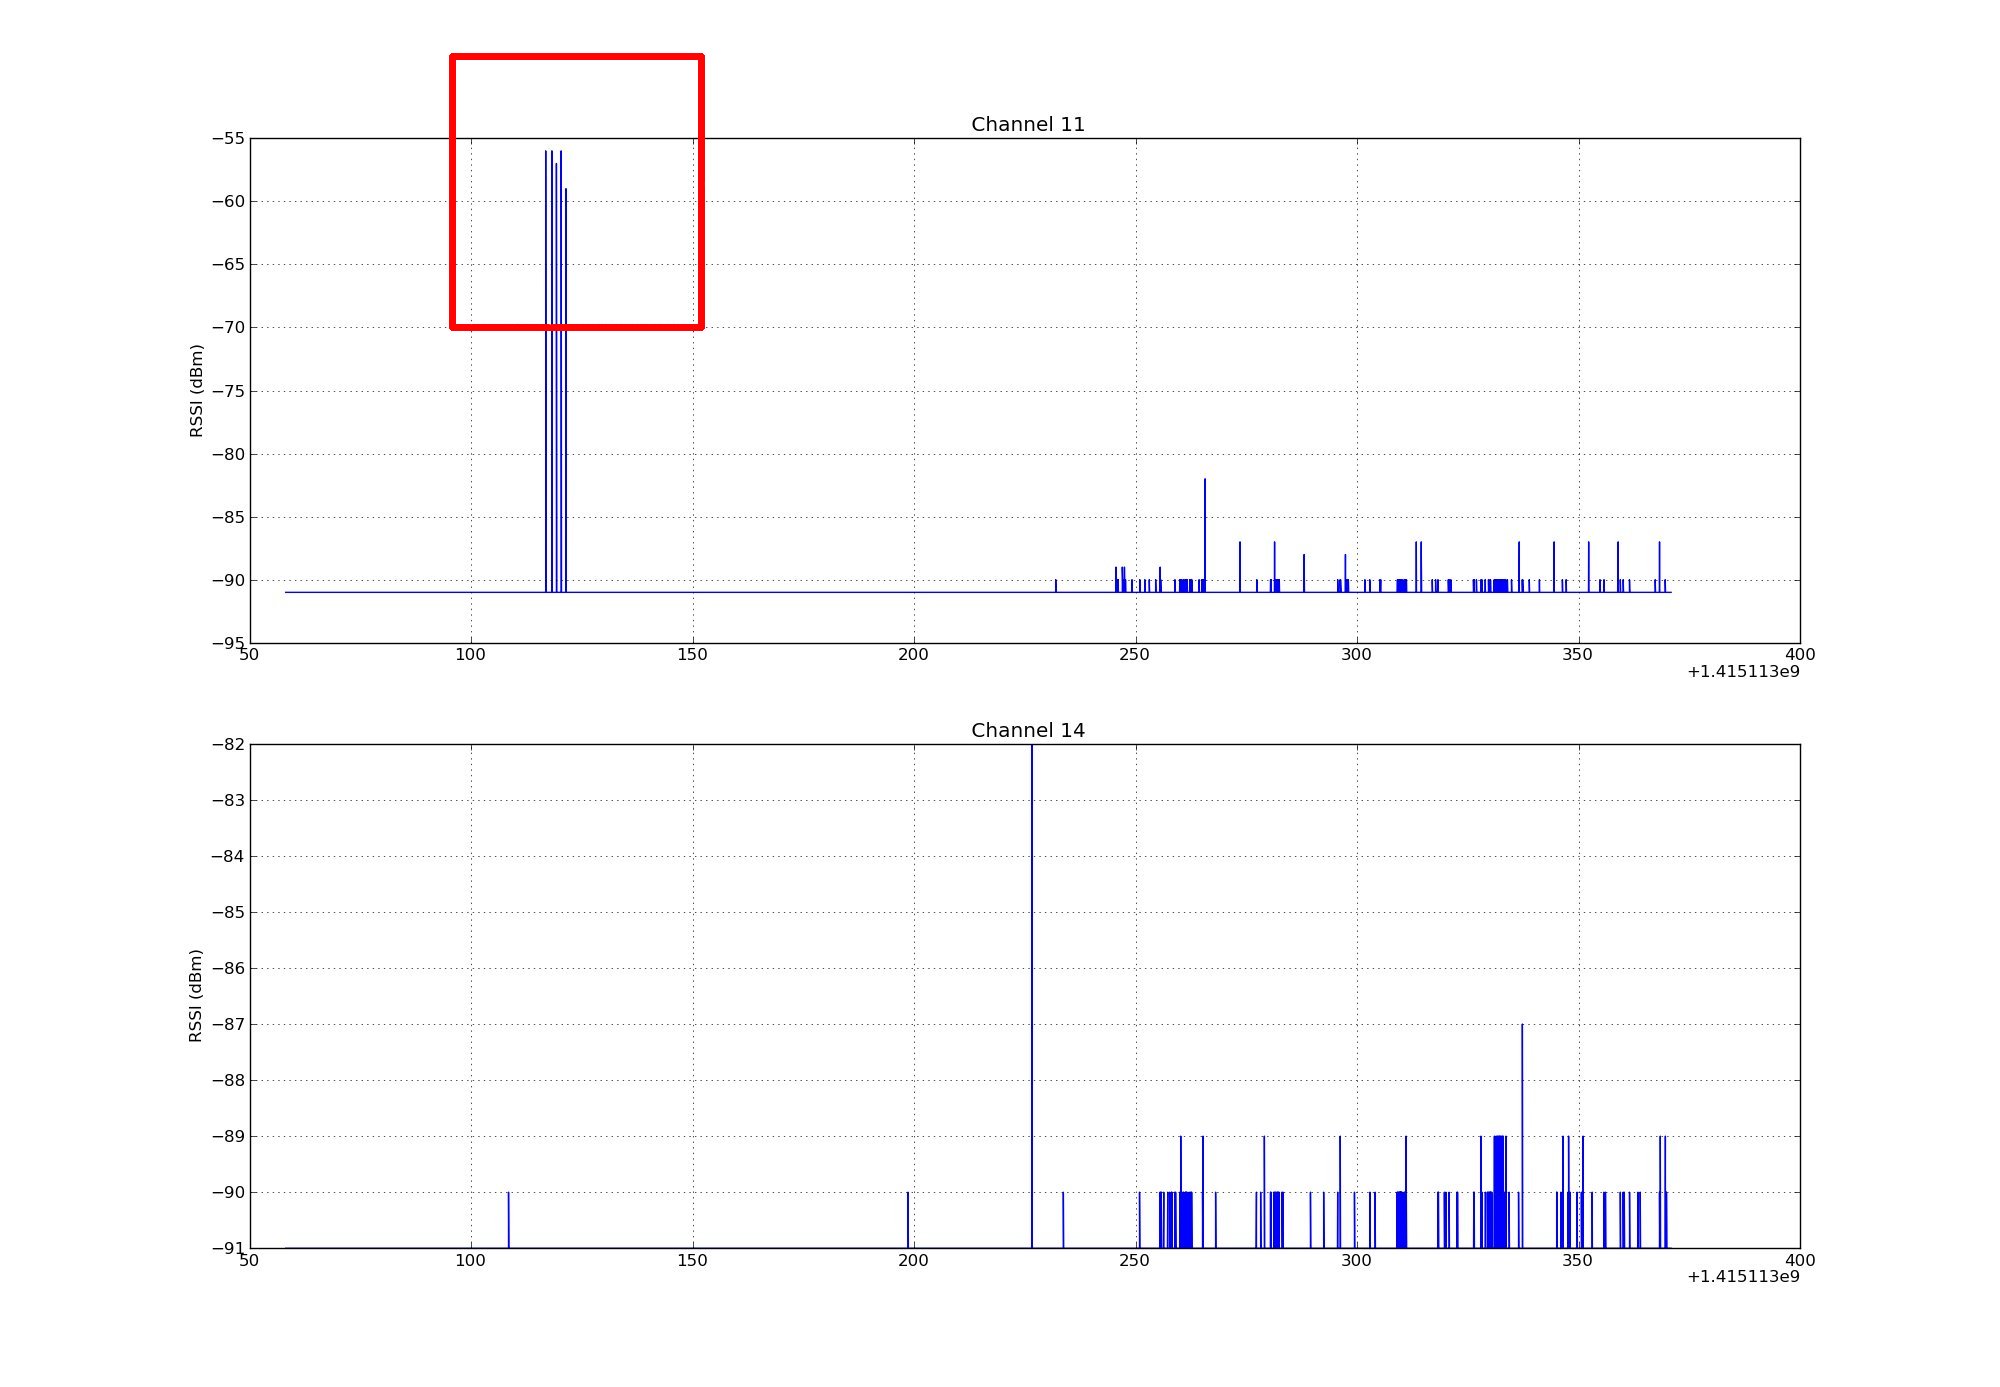
<login>@grenoble:~$ plot_oml_radio -a -i ~/.iot-lab/last/radio/m3_<id>.oml
Check that you observe the peaks in the measured RSSI that happen when sending the big packets on channel 11. Check that you observe only noise on channel 14. Depending on the radio environnement perturbations, you should measure a RSSI near -91 dBm with relative noise.
RSSI Additional informations
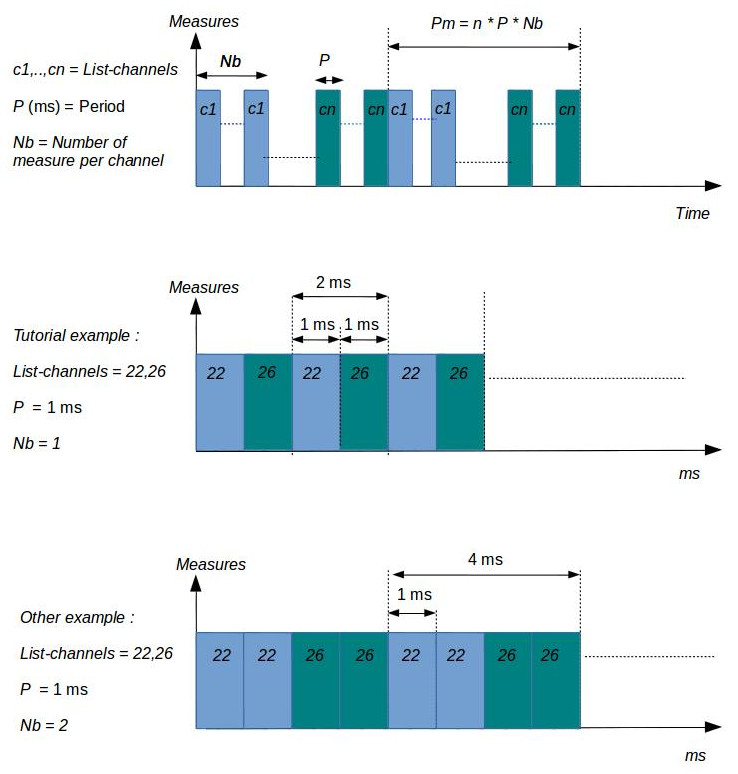
When you select the Radio RSSI mode, you must configure three parameters:
- The radio channel list to monitor. Indeed the physical layer (PHY) 802.15.4 divides the bandwith 2400–2483.5 MHz in sixteen channels : 11 to 26. You can share the monitoring time to measure RSSI on several channels.
- The Period parameter is the time (ms) duration of one measure for a channel
- The Number of measure per channel represents the number of times of measurements per channel
The figures below illustrates some monitoring configurations:
Sniffer monitoring
Create a monitoring profile
You have two ways to create a monitoring Profile, the IoT-LAB Webportal or CLI command-line tools. In both cases you must create a Profile with a name, M3 architecture and the following configuration:
- Monitor radio: Sniffer mode.
- Channel 11 (used by the firmware)
View this section for additional informations.
In the Webportal go to the Resources Monitoring page and click New profile button.
With command-line tools use these commands:
$ iotlab-auth -u <login> # optionally store your credentials if you haven't done it before.
$ iotlab-profile addm3 -n <profile_name> -sniffer -channels 11
Launch an experiment
To illustrate the radio monitoring we will launch an experiment with:
- a duration of 20 minutes
- two M3 nodes on Grenoble site
- a firmware with which we can send radio packets
- the radio monitoring profile we have just created.
In the Webortal go to the New Experiment page and select nodes by node properties (one M3 node on Grenoble site) and attach the preset firmware (iotlab_m3_tutorial) and the consumption monitoring profile.
You can note that it’s possible to have a different monitoring configuration for each node of your experiment.
With command-line tools use these commands:
$ wget https://iot-lab.github.io/assets/firmwares/tutorial_m3.elf .
$ iotlab-experiment submit -d 20 -l 2,archi=m3:at86rf231+site=grenoble,tutorial_m3.elf,<profile_name>
$ iotlab-experiment wait
$ iotlab-experiment get -ni
Send radio packets and analyse radio traffic
Open two shells on the frontend server:
- one to send radio packets with the
serial_aggregatortool. - one to analyse radio packets with the
sniffer_aggregatortool.
The sniffer aggregator tool is an equivalent of serial_aggregator tool for aggregate all sniffer radio links of your experiment. When you configure your experiment with a sniffer radio monitoring profile the nodes forward on a tcp socket (on port 30000) the radio captured traffic. The radio packets are encapsulated with ZEP format(ZigBee Encapsulation Protocol). View this section for additional informations.
$ ssh <login>@grenoble.iot-lab.info
<login>@grenoble:~$ sniffer_aggregator -r -d -o - | tshark -V -i -
$ ssh <login>@grenoble.iot-lab.info
<login>@grenoble:~$ serial_aggregator
...
# Hit "Space+Enter" to stop the flood.
m3-<id>;s # Send a radio packet from one node
m3-<id>;b # Send a big radio packet from another one
Sniffer Additional informations
The Control Node hardware in charge of radio sniffer monitoring has the same radio chip, Atmel AT86RF231, as M3 nodes or A8-M3 nodes. It listens on the configured channel for incoming packets. On reception, it encapsulates them as ZEP (ZigBee Encapsulation Protocol) and it’s sent by the node to the SSH frontend server with a TCP socket on port 30000.
<login>@grenoble:~$ nc m3-<id> 30000
EX~
    0~��|�k'-^)���i��Hello World!: 2*,`EX~
                                                0~��|�p�U�9�B�i��Big Hello World!: 1 012345678901234567890123456789012345678���^C
The sniffer_aggregator is the sniffer version of the serial_aggregator tool. It allows connecting to nodes sniffer radio link, parse the received data to extract ZEP packets and writes them as a PCAP out file.
PCAP saving can be done in two different ways:
- pcap-ZEP: ZEP packet encapsulated in UDP packet send to port 17754 (Wireshark link)
- pcap-802.15.4: 802.15.4 payload extracted and saved in a 802.15.4_link_layer pcap file. (with the –raw option)
The pcap-ZEP format keeps all informations on channel/LQI/timestamp, but some tools need the pcap-802.15.4 format like foren6 tool.
In the control node code, on valid packet reception (crc errors packets are dropped by radio phy layer), the packet is encapsulated as ZEPv2 by the following to_zep function.
The ZEPv2 header has the followinf format with type Data (1)
Preamble|Version| Type |Channel ID|Device ID|CRC/LQI Mode|LQI Val|NTP Timestamp|Sequence#|Reserved|Length
2 bytes |1 byte |1 byte|  1 byte  | 2 bytes | 1 byte     |1 byte | 8 bytes     | 4 bytes |10 bytes|1 byte
The reserved space is also used to put some additional info
|           Reserved           |
|           10 bytes           |
|rx_time_len(us)| rssi | unused|
|2 bytes        |1 byte|7 bytes|
The PCAP encapsulation is performed manually on packet reception by the sniffer_aggregator tool.