Design
Explanations on the testbed design, how services are deployed and accessible, and how hardware features are accessible remotely.
Infrastructure
The figure below gives you a schematic overview of the infrastructure.
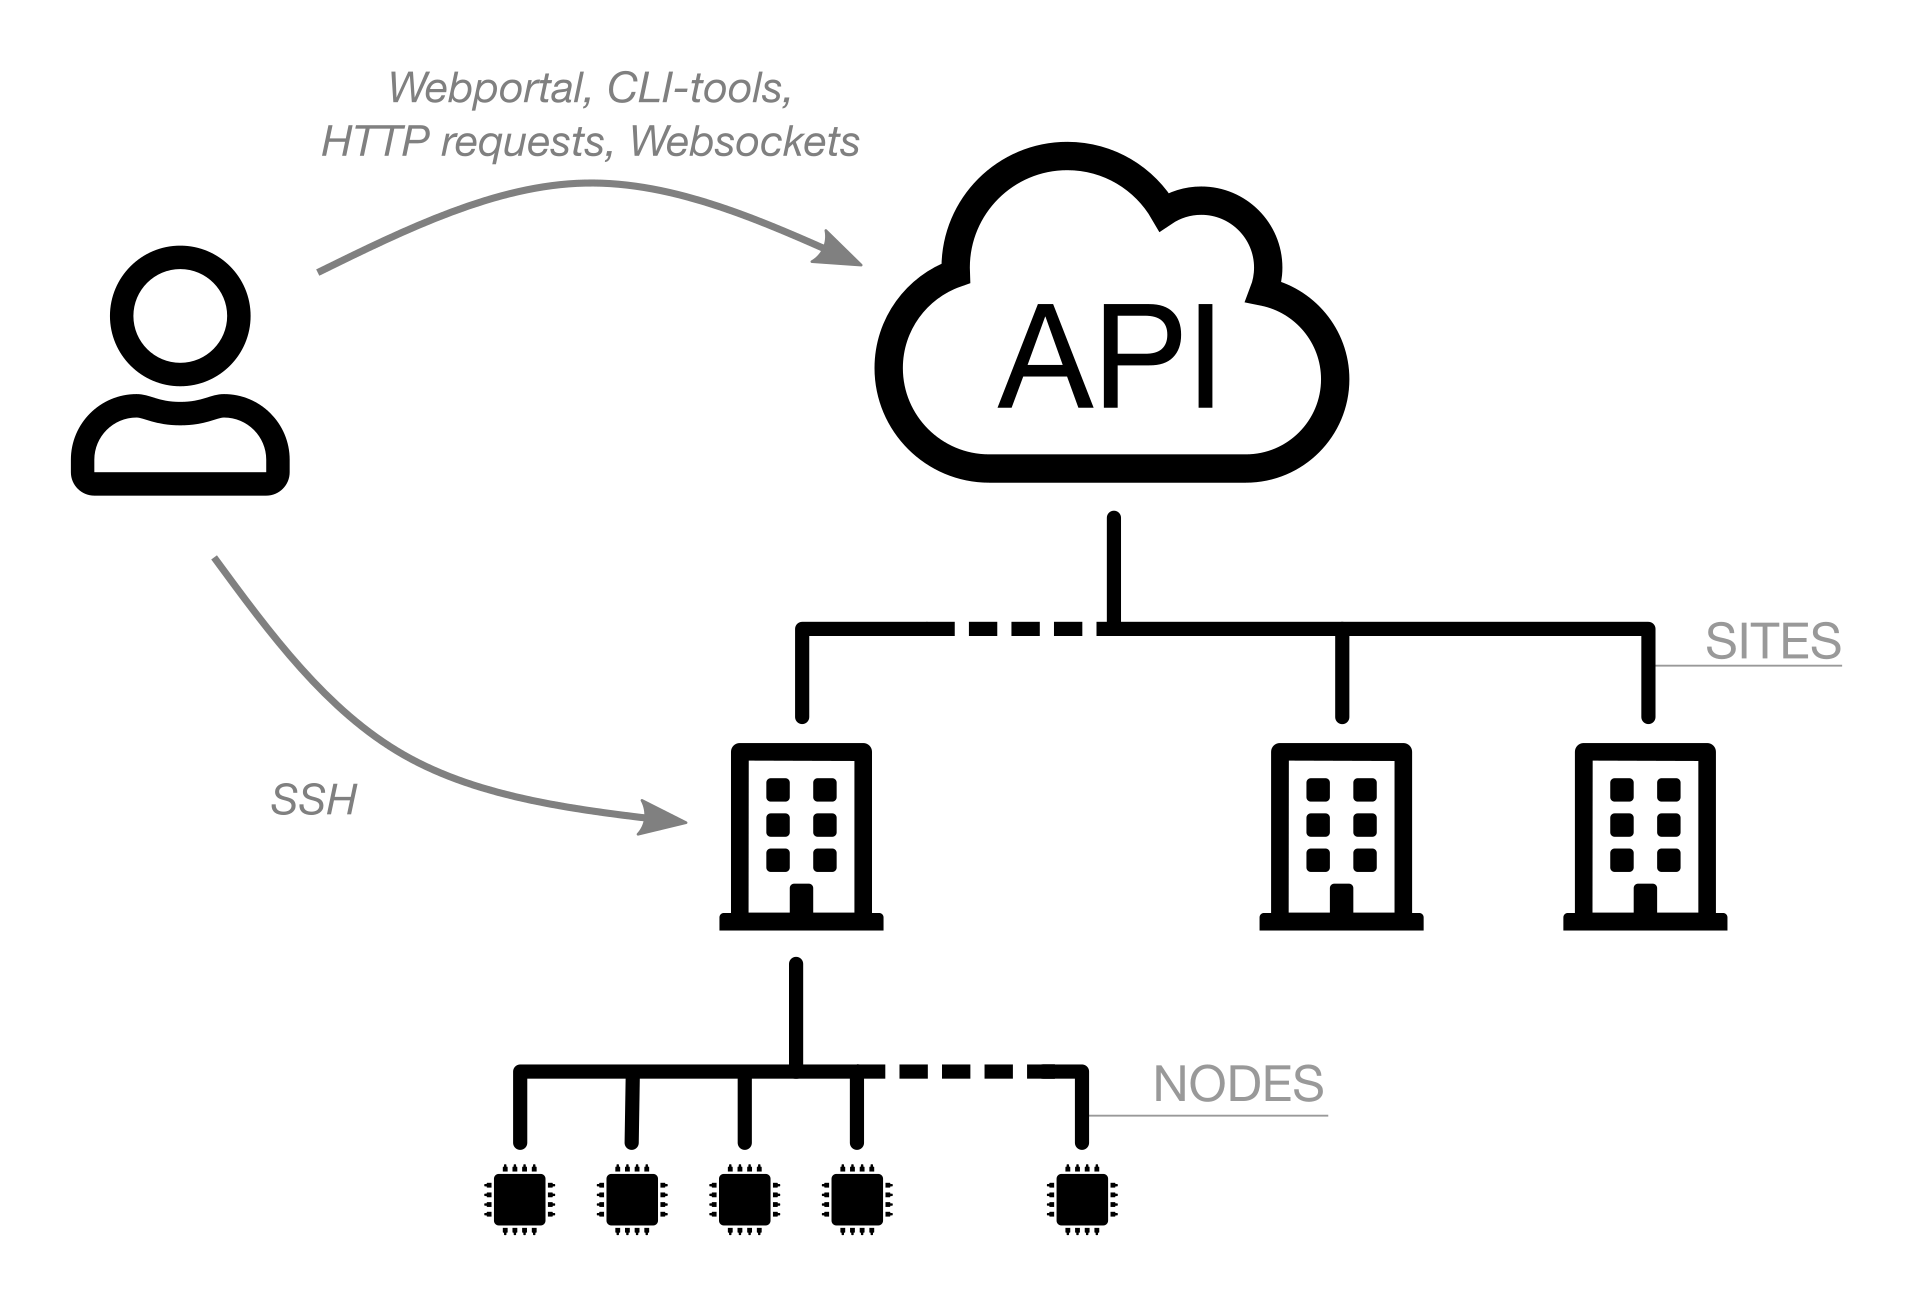
Here is some explanation of the different elements.
- The user interacts with the testbed thanks to two main clients:
- the Webportal, an easy-to-use and intuitive tool, letting you create an experiment on several hundred boards in just a few clicks;
- the CLI tools, for advanced uses or for task automation.
- The central access point of testbed is its open REST API, managing user requests, and dispatching orders over the different sites.
- On each site, a server accessible via SSH (known as SSH frontend) offers access to a development environment, as well as collected data, plus serial link, debug interface and radio sniffing interface of boards.
- Each site hosts a number of boards, also called experimenation nodes
Hardware
Integration
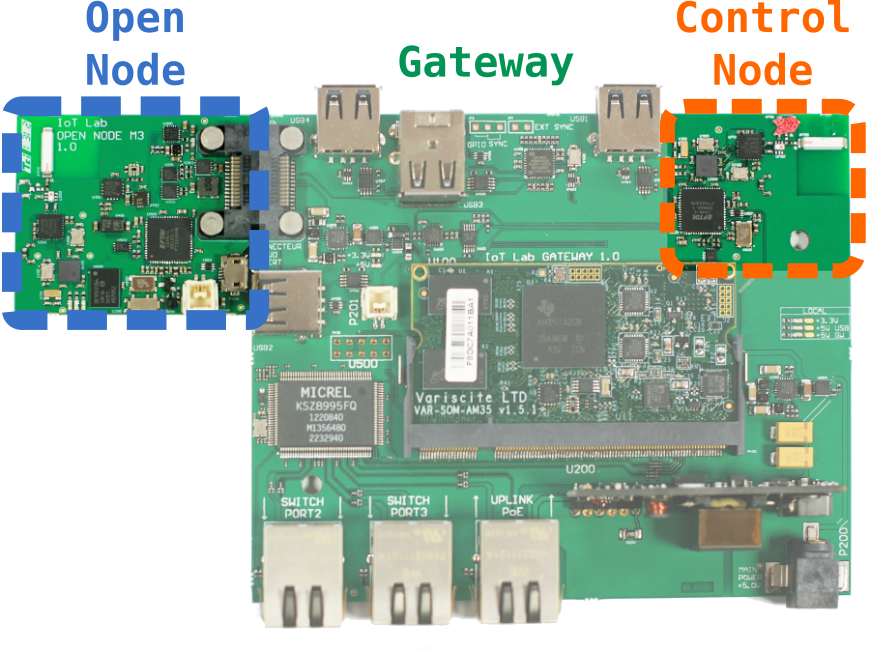
IoT development boards are commonly connected to a computer via a USB port for programming and debugging. In a context of experimenting with applications or network protocols on a large scale, it becomes tedious to reprogram a dozen or even a hundred objects in this way.
The IoT-LAB provides a solution to this problem by integrating each experimentation board called Open Node (ON) behind a mini-computer called Gateway (GW). The term ‘gateway’ is used here in a hardware sense, as it links the experimentation board with the other hardware components of the platform. This gateway will be in charge of programming the experimentation board. In addition to this intermediate gateway, an autonomous on-board system called Control Node (CN) is able to monitor the Open Node to measure its energy consumption, radio noise and traffic. The advantage of using a dedicated MCU is to guarantee real-time execution of these measurements. Finally, the complete IoT-LAB node is connected via a private network to a IoT-LAB site server which will be able to manage it remotely.
Interaction
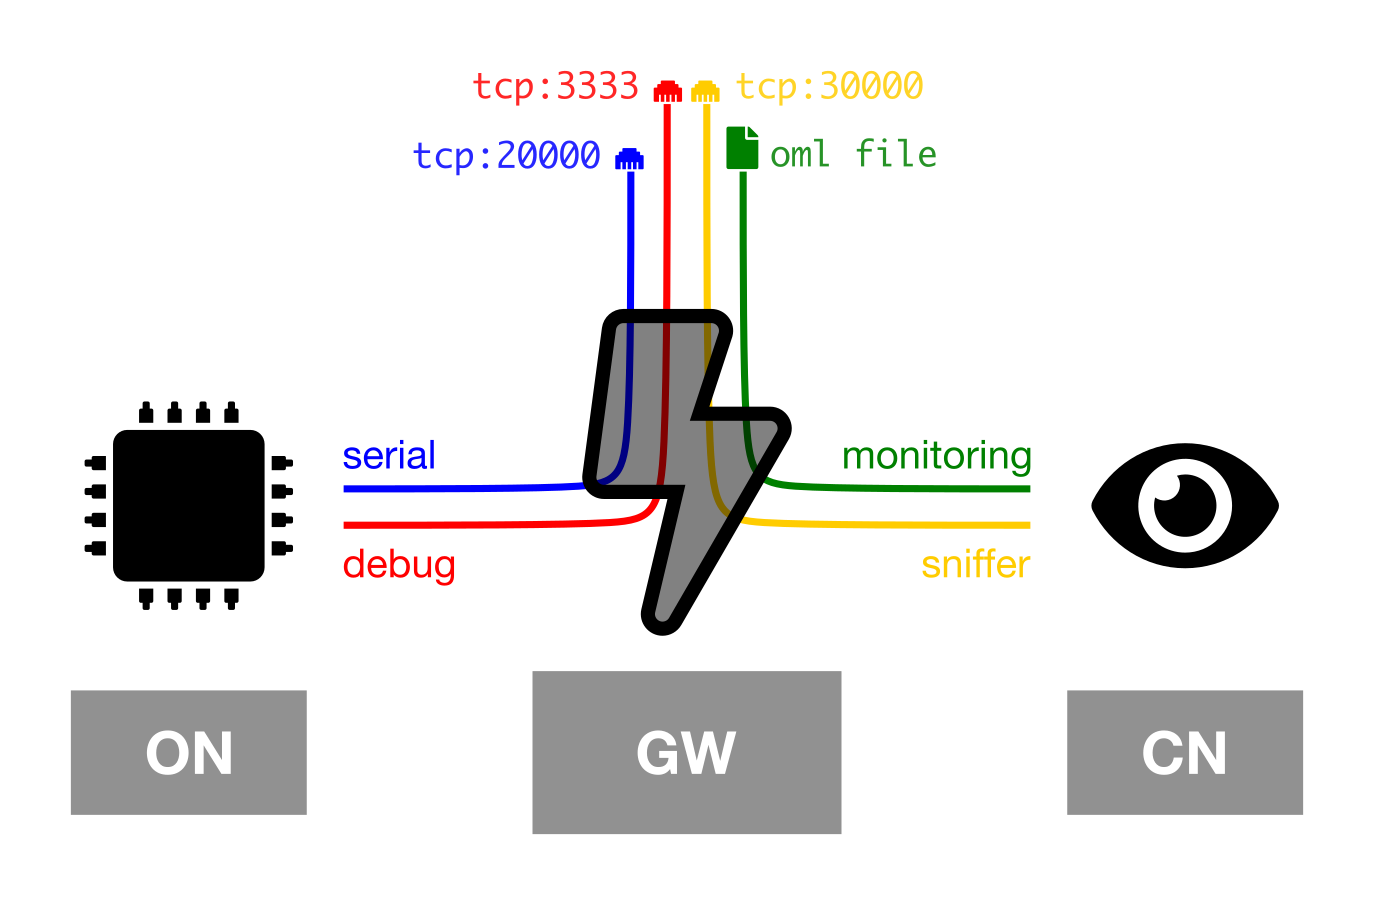
To facilitate deployment, the Gateway includes a PoE (Power Over Ethernet) module which, as its name suggests, allows power to be supplied via the Ethernet port in addition to the network link. Being the only link to the hardware, it is used to sent back the Control Node data:
- the sniffer data is written to a TCP socket served by the Gateway on port 30000;
- the automatic monitoring data is written directly to files in the user’s workspace.
It is also through this link that the usual physical interaction links with the experimentation board pass, and they vary according to the type of board.
For boards based on a microcontroller:
- the serial link of the Open Node is redirected to a TCP socket served by the Gateway on port 20000;
- the debug link of the Open Node is redirected to a second TCP socket served by the Gateway on port 3333.
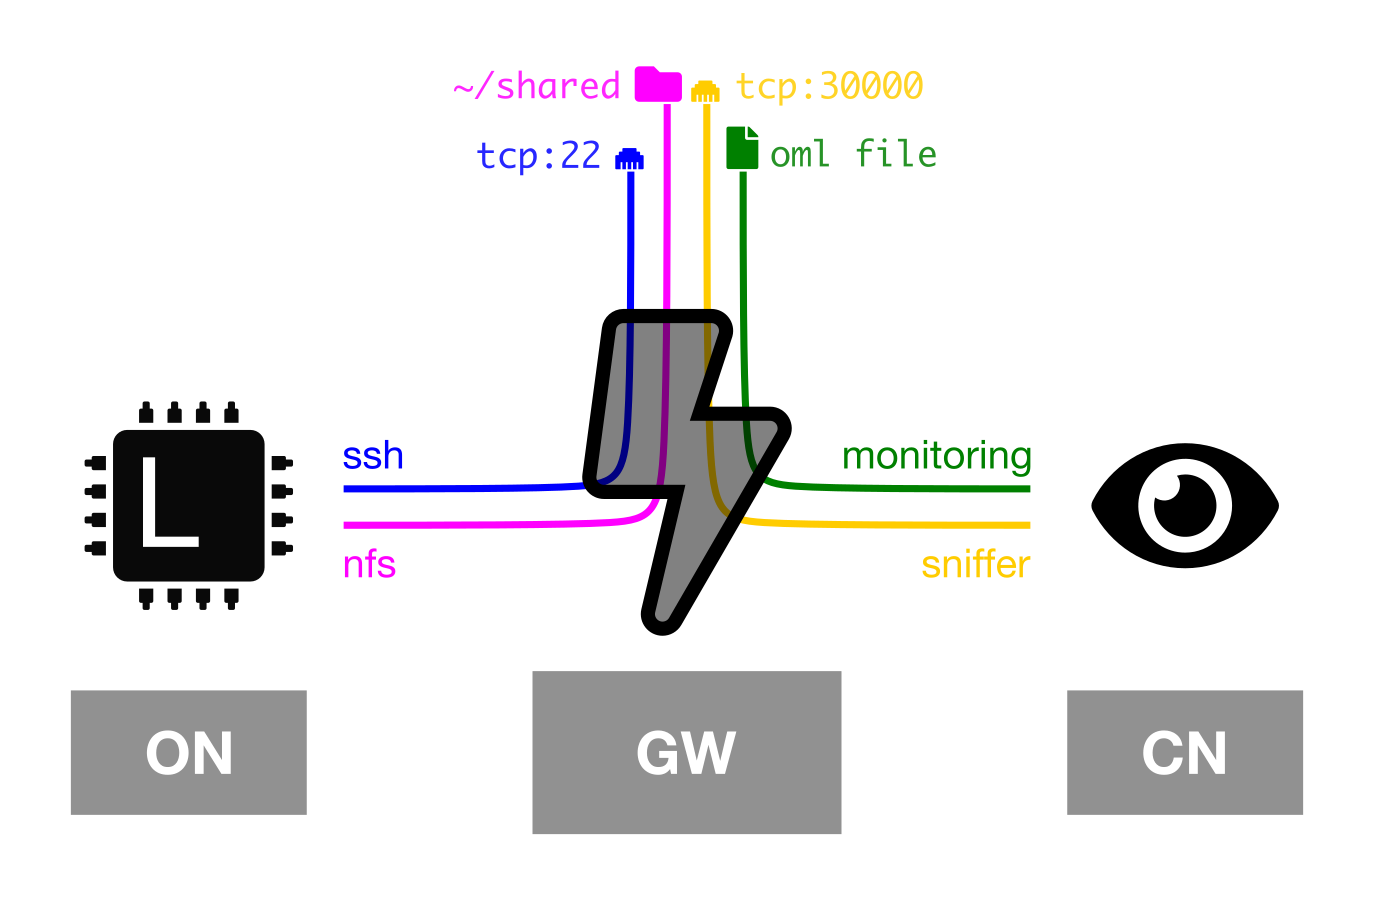
For boards running an embedded Linux:
- an SSH access to the Open Node is available through the classic 22 TCP port;
- the
~/shareddirectory present in the user’s workspace on the SSH frontend is mounted through NFS and accessible in the Open Node filesystem at the same path.
Dynamic network filtering rules make these links only accessible to the user who has reserved these experimentation nodes, from the SSH frontend of the site concerned, for the duration of the experiment.
Note that there is tools to help you to manage several serial or sniffer links, as well as to plot consumption or radio monitoring data.